From Mathijs de Wit – Newion Investments (@mathijsdewit)
When assessing early stage investment opportunities, market size and market growth are among the most important topics to research. Determining this is extremely important for a general understanding of a certain market. Next up is the market deep dive and one the most interesting ways to illustrate market dynamics is to show understanding market demographics. However, somehow this is a topic that has not been written about extensively yet, albeit it is important for assessing many other parts of the business strategy such as marketing and sales. Therefor this blog proposes a nice little model that visually gets right to the point of market demographics.
Markets exists of small, large and anything in between sized customers. Different markets have different profiles. For example, selling to financial institutions is completely different than selling to ecommerce companies. The first step is to visualize the amount of small and large customers. Similar to visualizing if a market is a long or short tail market. This is right side of the model.
The next step is to understand and visualize the costs to acquire and serve the different segments. This is the left side of the model. Resulting in an easy visual to understand markets and what parts are attractive to focus on and shape your strategy for.
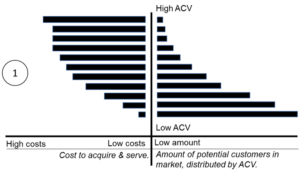
For visual 1 depicting a certain set market, it makes a lot of sense to shape your company to address the lower-end of the market, as there are many customers there and apparently the cost to acquire and serve is much lower than higher-end of the market.
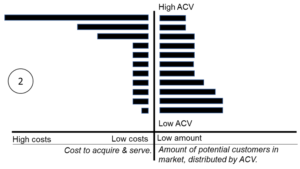
Now let’s take a look at two very clear examples, selling software to financial institutions or ecommerce companies.
Visual 2 shows the visual for selling software to the financial institutions market. There are relatively many top tier and second tier customers compared to the low-end of the market. However, the upper end of the top tier is expensive to acquire and serve. It therefor makes total sense to shape a strategy towards the tier 2 customers.
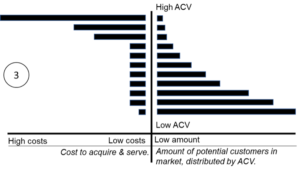
Visual 3 shows the visual for selling software to the ecommerce market. Here the costs side is similar to the financial institutions costs profile, however, the amount of lower-end customers is extremely more and therefor could be a far more interesting strategy.
It makes sense to use these models as a basis to get a better understanding of why a certain company does direct sales or free-trials. Ultimately, it also results in improving a company strategy, as it is fundamental knowledge about what customers segments a company can scale in or become very profitable in. Would be great to hear about people that find this useful!